Effective human resource management is vital for the success of any organization. HR professionals need comprehensive tools to streamline processes and optimize workforce management, from recruitment and onboarding to performance tracking and employee engagement.
In this blog, we will delve into the top 7 free Power BI Templates tailored specifically for HR management. Drawing inspiration from the success of our previous article on sales management, where we explored the top 7 Power BI templates for sales teams, we aim to provide HR professionals with the tools they need to enhance their HR practices and foster a productive and engaged workforce.
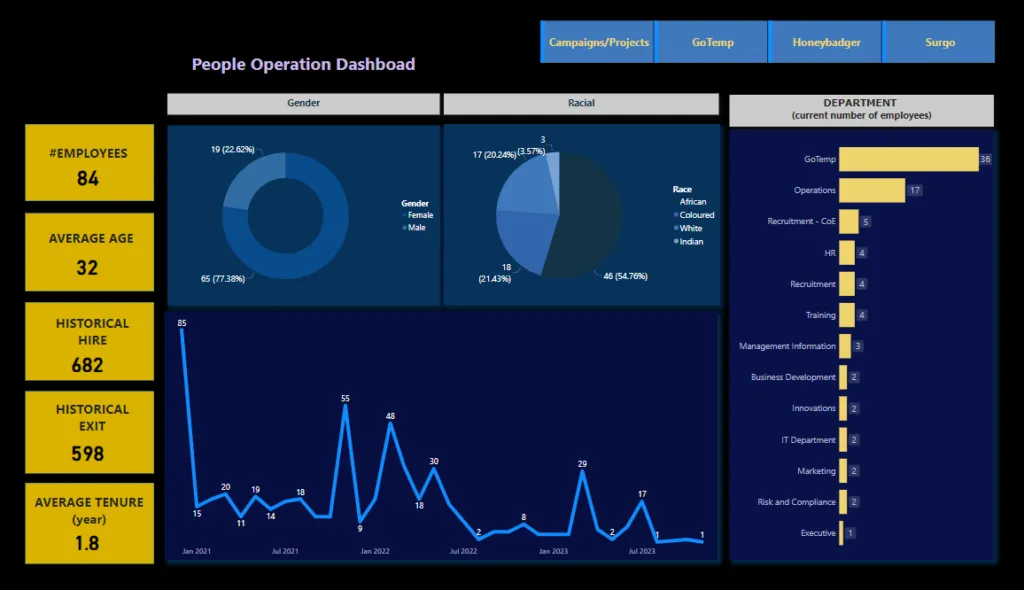
HexaSync Power BI template for HR Reports – Template 1
Overview: This template shows important HR numbers that help businesses understand their staff situation, including gender balance, departmental distribution, and changes over time. Presenting data clearly and giving useful insights helps business leaders make smart decisions about managing their teams effectively.
Key Insights for the Power BI Example Dashboard:
- Average of Tenure by Team: this chart helps visualize the distribution of employee tenure within different teams, providing insights into team dynamics, retention rates, and overall organizational stability.
- Employee Satisfaction Analysis by Role: Utilizing survey data and sentiment analysis, Power BI templates provide a holistic view of employee satisfaction levels across distinct positions or job roles, empowering HR teams to address role-specific challenges and bolster overall employee engagement and retention efforts.
Source: Microsoft| Fabric Community| HR Report
HexaSync Power BI template for HR Reports – Template 2

Overview: This template offers a snapshot of key HR metrics, aiding businesses in understanding their workforce composition, gender distribution, departmental allocation, and trends over time. With concise data and analysis, it facilitates strategic decision-making to balance personnel resources effectively.
Key Insights for the Power BI Example Dashboard:
- Workforce Composition Analysis: Utilize charts and summary tables to understand the structure of the workforce, enabling strategic decisions regarding talent development and performance management.
- Recruitment Status Statistics: Visualize recruitment data, including candidate numbers, recruitment positions, and hiring duration, helping management gain insights into the current status of the recruitment process.
- Overall Performance Evaluation: Aggregate personnel data to assess the overall performance of the organization, identifying trends and specific issues to adjust human resource management strategies.
Source: Microsoft| Fabric Community| HR Report
3. HexaSync Power BI template for HR Reports – Template 3
Overview: This report provides a comprehensive overview of key HR metrics, shedding light on the company’s workforce composition. Additionally, it analyzes personnel distribution by department, gender ratio, and work-life balance by department, and notably includes charts illustrating employee satisfaction by position. This report enables businesses to gain insights into their workforce dynamics, adjust position satisfaction rates, and ultimately enhance labor efficiency.
Key Insights for the Power BI Example Dashboard:
- Key HR Metrics Overview: Power BI templates provide a centralized dashboard displaying essential HR metrics such as Number of Employees, Averages of Performance, Active Employees, Total Hours Worked, average age, and Attrition Rate.
- Work-Life Balance Insights by Department: Through interactive charts displaying metrics like overtime hours, remote work frequency, and employee satisfaction surveys, these templates provide actionable insights into work-life balance by department, helping HR managers identify areas for improvement and implement targeted interventions.
- Employee Satisfaction Analysis by Position: Leveraging survey data and sentiment analysis, Power BI templates offer a comprehensive view of employee satisfaction levels across different positions or job roles, enabling HR teams to address issues specific to certain roles and enhance overall employee engagement and retention.
Source: Microsoft| Fabric Community| HR Report
4. HexaSync Power BI template for HR Reports – Template 4
Overview: This report focuses on analyzing employee composition based on aspects such as gender, marital status, departmental distribution, and the allocation of employee salaries based on these factors.
Key Insights for the Power BI Example Dashboard:
- Key HR Metrics Overview: Power BI templates provide a holistic view of essential HR metrics, including mean age, total employees, mean monthly income, mean hourly rate,…
- Marital Status Analysis: Utilizing pie charts or bar graphs, these templates visually represent the distribution of employees based on marital status, aiding in understanding workforce demographics and potentially informing benefits or wellness programs.
- Salary Allocation Analysis: Leveraging interactive tables or charts, Power BI templates present salary distribution across departments or job roles, enabling HR managers to identify disparities, ensure fairness, and optimize salary budgets effectively.
Source: Microsoft| Fabric Community| HR Report
5. HexaSync Power BI template for HR Reports – Template 5
Overview: Similar to previous reports, this report delves into essential HR metrics, offering insights into employee numbers and dissecting their distribution and earnings based on variables like gender, marital status, age, and job satisfaction. Moreover, it furnishes data on average commuting distances, typical work hours, and training duration through informative charts.
Key Insights for the Power BI Example Dashboard:
- Key HR Metrics Overview: Power BI templates present a comprehensive overview of crucial HR metrics such as total hourly rate, total monthly income, and total number of employees.
- Salary Allocation Analysis: Leveraging interactive dashboards, Power BI templates present salary distributions across departments or job roles, allowing HR managers to identify disparities and ensure equitable compensation practices.
- Typical Work Hours Visualization: Through line graphs or histograms, these templates visualize typical work hours across different departments or employee categories, aiding in workforce planning and scheduling optimization.
- Training Time Insights: Utilizing stacked bar charts or trend analysis, Power BI templates provide insights into training time spent by employees, helping HR teams evaluate training effectiveness and plan future development initiatives efficiently.
Source: Microsoft| Fabric Community| HR Report
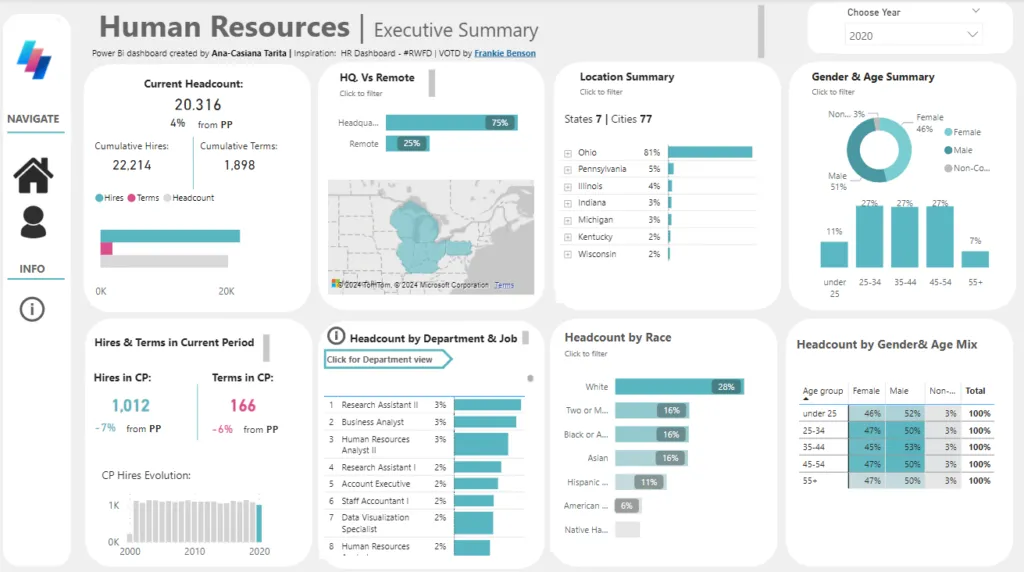
6. HexaSync Power BI template for HR Reports – Template 6

This report analyzes key metrics related to headquarters and remote work, focusing on hiring trends and employment terms for the current period. It highlights employee distribution and variations in contract types.
Key Insights for the Power BI Example Dashboard:
- Workforce Distribution: Visualize the split between headquarters and remote employees to understand workforce dynamics.
- Hiring Trends: Explore new hires, termination rates, and contract types during the current period for effective workforce planning.
- Employment Terms: Analyze various employment types (full-time, part-time, contract) to assess workforce composition.
- Remote Work Metrics: Evaluate remote work policies and employee engagement to enhance satisfaction and productivity.
Source: Microsoft | Fabric Community | HR Report
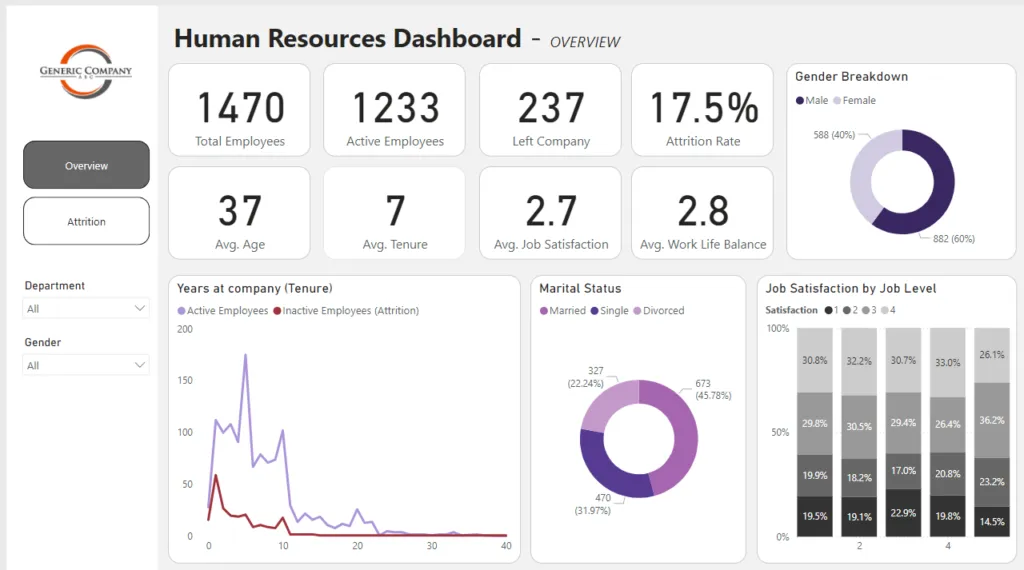
7. HexaSync Power BI template for HR Reports – Template 7

This report provides an in-depth analysis of key metrics related to headquarters and remote work, focusing on hiring trends, employee distribution, and variations in contract types for the current period.
Key Insights for the Power BI Example Dashboard:
- Year at Company: Assess employee tenure to identify retention trends and engagement levels over time.
- Gender Breakdown: Evaluate gender distribution within the organization to promote diversity and inclusion.
- Job Satisfaction by Job Level: Measure employee satisfaction across different job levels to identify areas for improvement and enhance overall morale.
Source: Microsoft | Fabric Community | HR Report
Conclusion
In conclusion, these top 7 free Power BI templates for HR management offer a powerful toolkit to elevate your human resources strategy. By utilizing these templates, businesses can gain invaluable insights into various HR metrics, streamline processes, and make informed, data-driven decisions. Implementing these templates can improve employee satisfaction, and ultimately, make greater organizational success. Embrace these tools to empower your HR teams, optimize processes, and foster a more productive and engaged workforce.
