Developing effective sales management strategies is crucial for businesses aiming to maximize performance and increase revenue. Microsoft’s Power BI, a business analytics tool, provides a robust platform for analyzing data, sharing insights, and making informed decisions.
Utilizing appropriate Power BI templates can greatly improve your sales management process. In this article, we will explore the top 7 Power BI templates for sales management, each addressing various aspects of sales and performance tracking.
1. HexaSync Power BI Template for Sales – Template 1
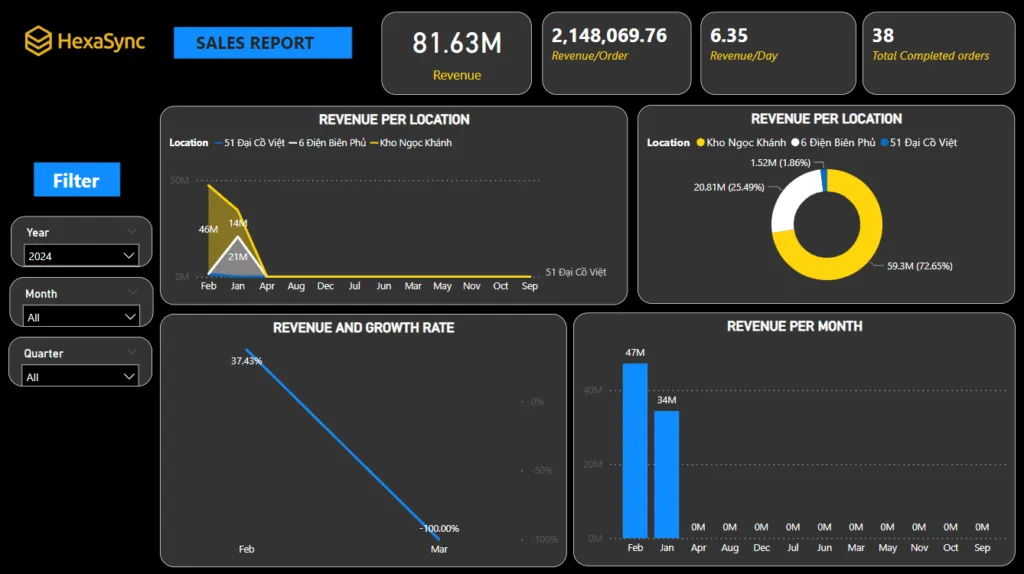
Overview: This report template offers a concise overview of key revenue metrics, including product sales, revenue by warehouse, and growth rates. Viewers can quickly identify trends and opportunities for revenue growth with visually engaging charts and interactive features.
Key Insights for the Power BI Example Dashboard:
- Daily Revenue Management and Order Analysis: these templates provide a comprehensive dashboard that visualizes daily sales figures, highlighting trends and pinpointing areas of concern.
- Monthly and Quarterly Income Visualization: detailed insights enable financial planners and business owners to assess their company’s performance over time, identify seasonal trends, and make informed decisions on budget allocation, investment opportunities, and growth strategies
- Warehouse Efficiency Tracking: allows companies to track and analyze the performance of each warehouse, providing key metrics such as order fulfillment rates, inventory levels, and logistical costs, helps company understand the efficiency levels of different warehouses
- Store Growth Monitoring: monitoring the growth of each store is essential for regional strategy development and resource allocation. This template allows tracking monthly growth metrics for each store, including sales volume, customer acquisition rates, and revenue growth.
You can effortlessly utilize templates by integrating your daily sales data from your retail channels into Power BI, enabling dynamic, real-time updates to your charts. Explore further at Sapo and Power BI Integration.
2. HexaSync Power BI Template for Sales – Template 2
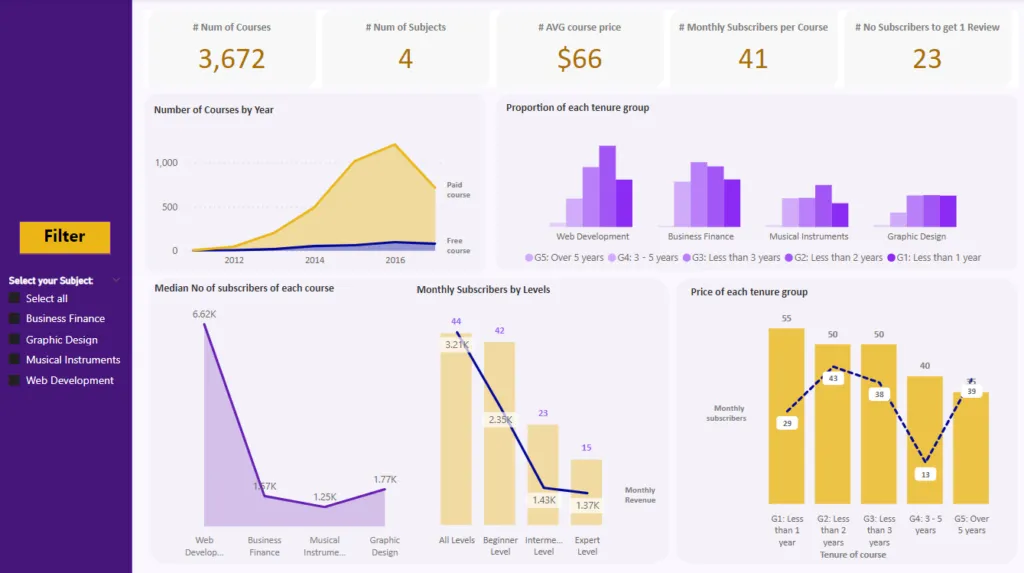
Overview: This template is tailored for sales teams looking to utilize educational content from Udemy to improve their sales performance. The report aids sales teams in monitoring sales metrics, subscriber counts, and course review rates.
The dashboard charts offer insights into course growth trends over time and viewer engagement rates, empowering Udemy to develop strategies to enhance sales effectively.
Key Insights for Power BI Example Dashboard:
- Revenue Management for Courses & Subjects: Power BI templates allow for efficient management of course and subject revenues, enabling the calculation of average revenue per course. This insight helps identify high-performing areas and optimize offerings.
- Price Change Analysis: By categorizing study groups based on duration (e.g., less than 1 year, more than 2 years), these templates help in analyzing and understanding the impact of price changes over time. This insight is crucial for strategic pricing decisions.
- Registration Monitoring: Keep track of registration trends by level, offering a clear view of demand and popularity across different courses or subjects. This data is vital for adjusting marketing strategies and resource allocation.
3. HexaSync Power BI Template for Sales – Template 3
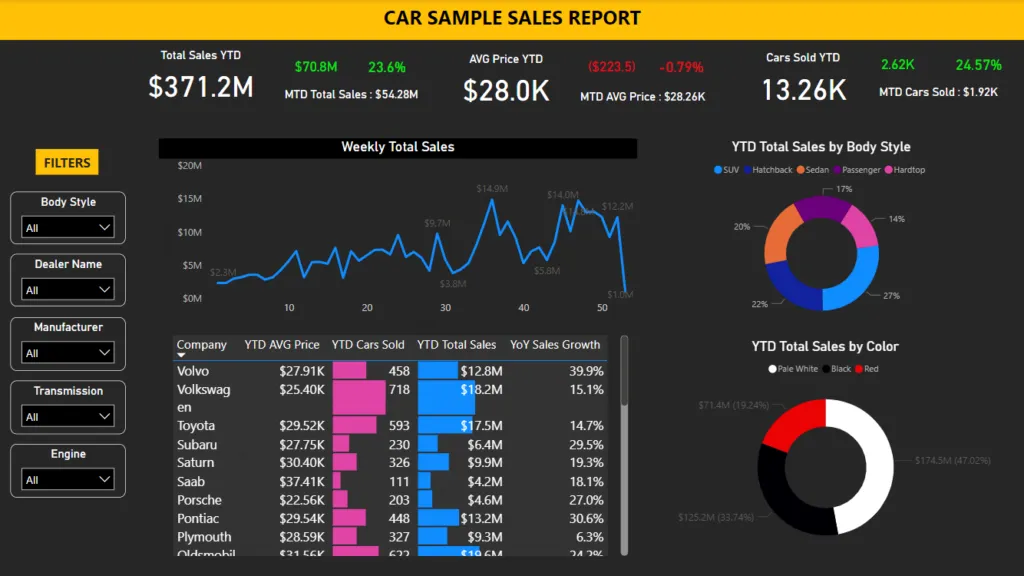
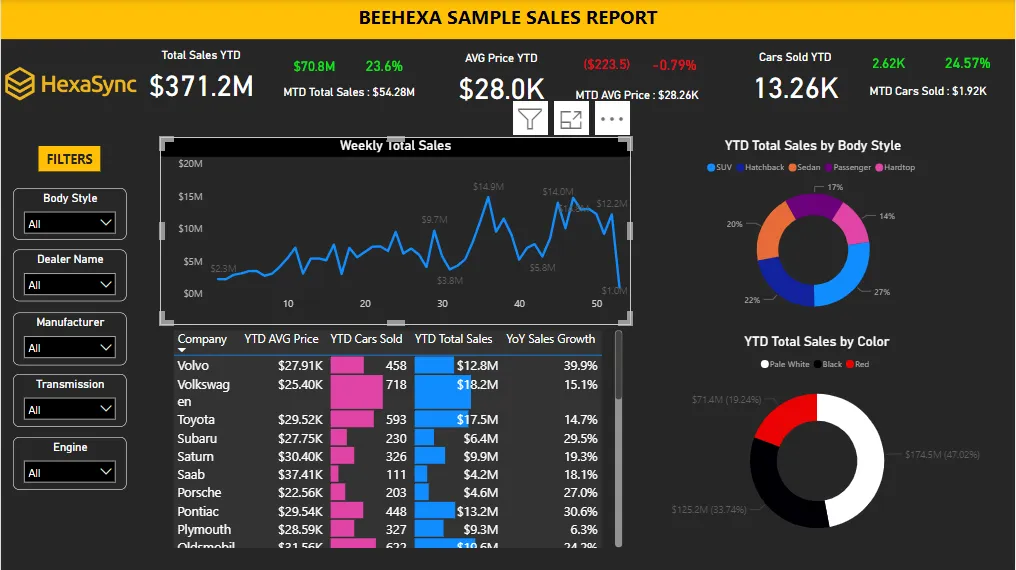
Overview: Ideal for businesses engaged in self-manufacturing and retail, this template provides a comprehensive overview of sales data over time, categorized by color, vehicle model, and revenue by region. It allows businesses to analyze revenue data from various perspectives, offering a 360-degree view of their sales activities.
Key Insights for Power BI Example Dashboard:
- Overall Finances & Regional Growth: Power BI templates give you a clear view of your company’s financial health and track growth across different regions. This helps in understanding where the company stands and in which areas it’s expanding.
- Branch Effectiveness & Categorization: Dive into the performance of each branch with details categorized by color, vehicle model, and revenue by region. This visualization allows for a detailed comparison and assessment of branch efficiency.
- Weekly Sales Growth Control: Monitor and control your sales growth on a weekly basis with Power BI templates. This frequent check-in helps in staying updated with sales trends and making quick adjustments as needed.
4. HexaSync Power BI Template for Sales – Template 4
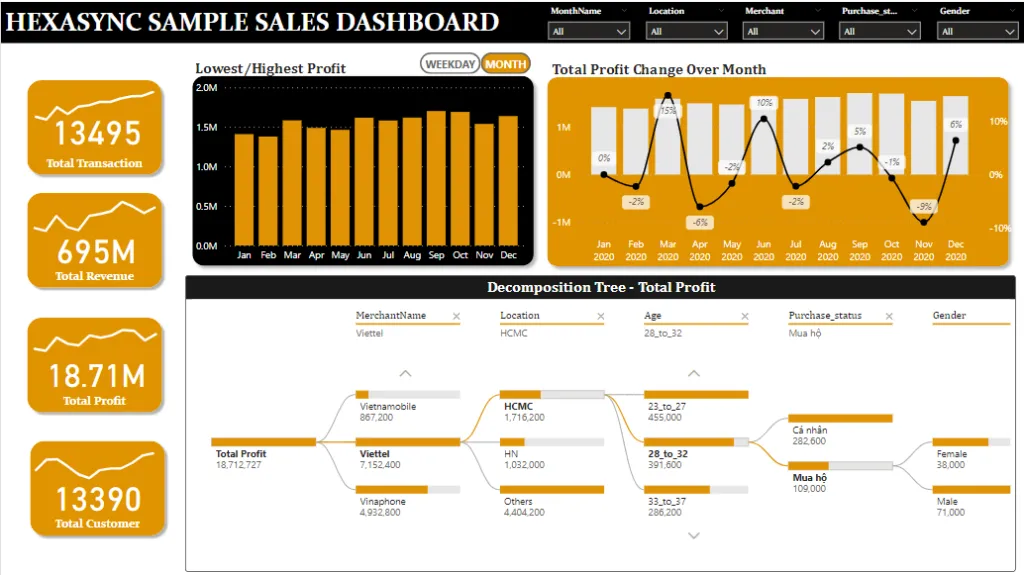
Overview: Focused on tracking profits and their fluctuations over time, this template provides insights into factors influencing profit and its allocation. The chart helps understand the profit’s dynamics, enabling planners to devise effective growth strategies.
Key Insights for Power BI Example Dashboard:
- Profit Performance Insights: Identify where profits peak and dip, offering a clear view of profit performance throughout the year and highlighting opportunities for improvement.
- Monthly Profit Breakdown: Analyze profits on a month-by-month basis, allowing for timely strategic adjustments to enhance profitability.
- Profit Distribution Analysis: Understand how profit ratios vary by factors like supplier, location, age, purchase status, and gender. This detailed analysis supports targeted decision-making and fine-tuning of strategies to boost profit margins.
5. HexaSync Power BI Template for Sales – Template 5
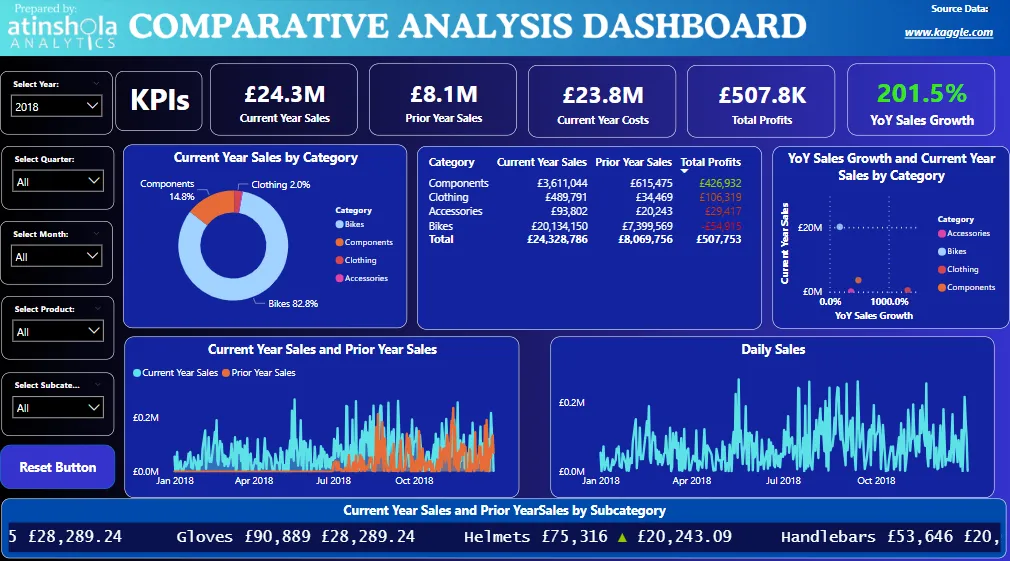
Overview: This template is designed to track sales performance and its variations over time, providing valuable insights into factors that influence sales and their distribution. The dashboard helps understand sales dynamics, enabling them to create effective strategies for growth.
Key Insights for Power BI Example Dashboard:
- Sales Performance Overview: Gain a comprehensive view of current year sales compared to prior year sales, highlighting total profits and year-over-year sales growth. This section identifies trends and areas for improvement.
- Sales Breakdown by Category: Examine current year sales categorized by product type, facilitating quick identification of high-performing and underperforming categories for targeted interventions.
- Daily Sales Tracking: Monitor sales on a daily basis to identify patterns, peak times, and potential issues, enabling more agile decision-making.
6. HexaSync Power BI Template for Sales – Template 6
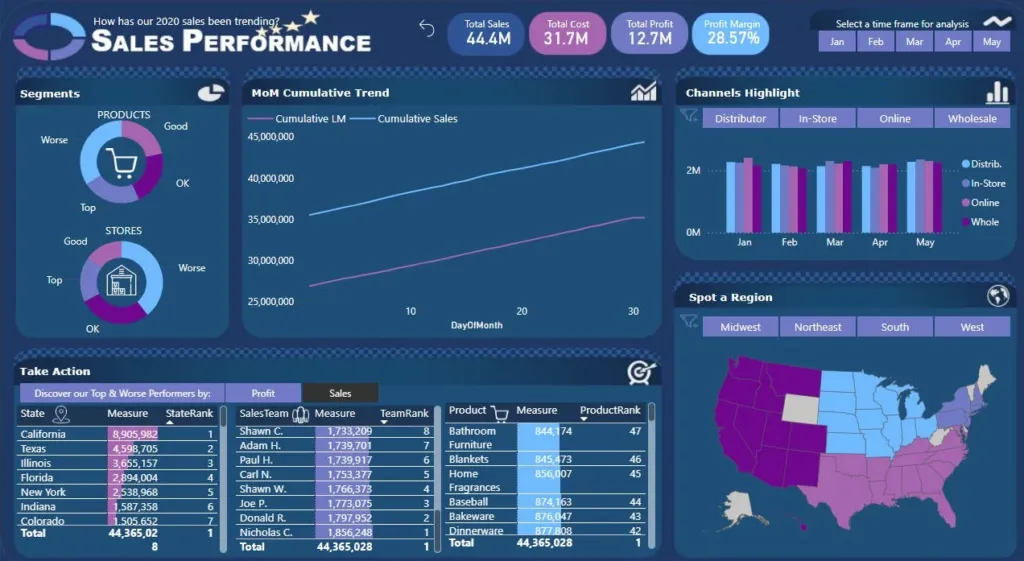
This template focuses on tracking sales trends and performance across various channels and regions, providing insights that inform strategic decision-making. The dashboard highlights key metrics, enabling teams to identify growth opportunities and areas for improvement.
Key Insights for Power BI Example Dashboard:
- Month-over-Month Cumulative Trend: Visualize cumulative sales trends over the months, allowing stakeholders to assess overall performance and spot seasonal fluctuations that can influence strategy.
- Channel Performance Highlights: Analyze sales data by channel, identifying which distribution methods are most effective. This insight aids in optimizing marketing efforts and resource allocation.
- Regional Performance Spotlight: Highlight sales performance by region to identify strong and weak markets. This analysis supports targeted initiatives to enhance sales in underperforming areas while capitalizing on successful regions.
7. HexaSync Power BI Template for Sales – Template 7
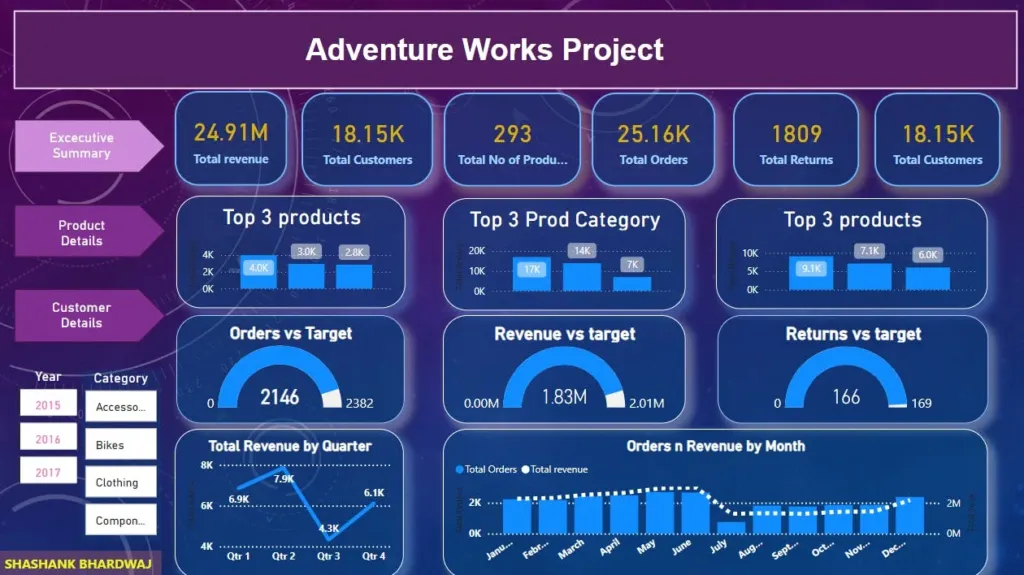
This report is designed to provide a comprehensive analysis of sales performance, focusing on key products and customer insights. It serves as a strategic tool for understanding market dynamics and guiding decision-making.
Key Insights for Power BI Example Dashboard:
- Executive Summary: Present a concise overview of the report’s findings, highlighting major trends, key metrics, and actionable insights for stakeholders.
- Product Detail:
- Top 3 Products: Identify the three best-selling products, showcasing their sales figures and contribution to overall revenue.
- Top 3 Product Categories: Analyze the leading product categories to understand which segments are driving the most sales, facilitating strategic focus on high-performing areas.
This structured reporting framework equips teams with essential insights to enhance product strategies and customer relations, ultimately driving sales growth.
How to Use Power BI Template For Sales Management
To use this template, you can follow these steps:
Step 1: Download the template from the provided link.
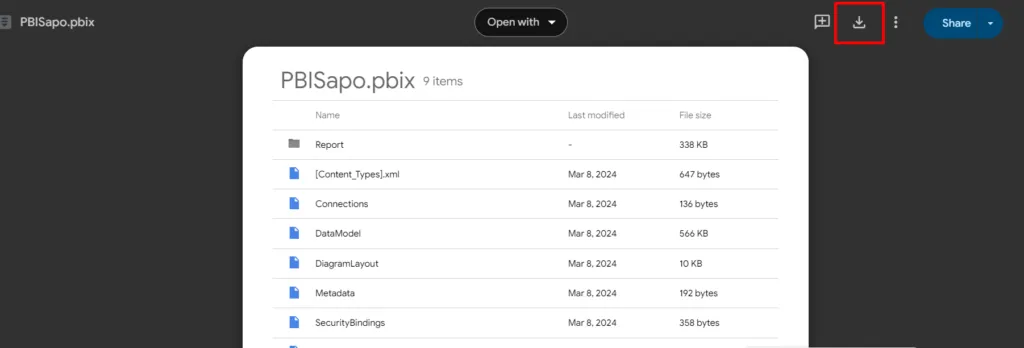
Step 2: Open Power BI Desktop or your compatible version.
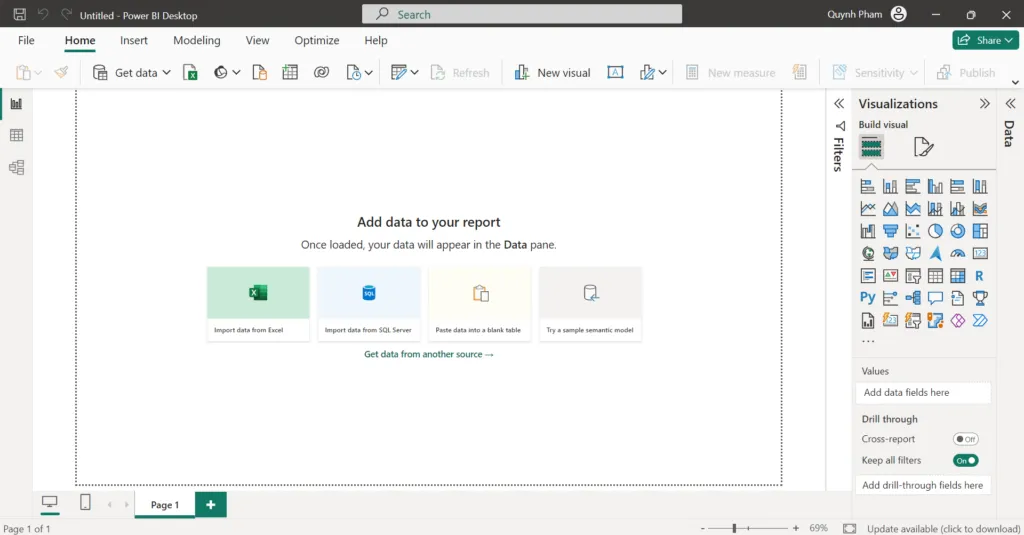
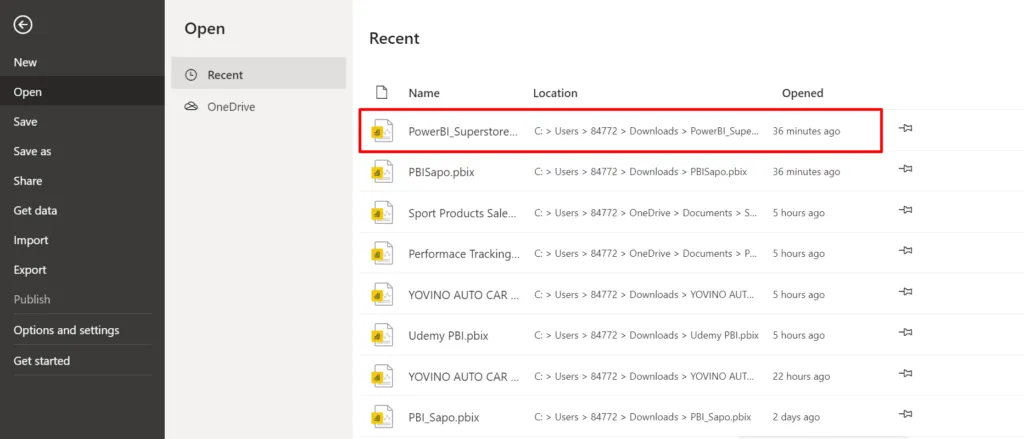
Step 4: In Power BI, select ‘File’ on the toolbar, then choose ‘Open’ and select the .pbix file you downloaded from step 1.
Step 4: Once the file is open, you’ll see the dashboard containing the charts and information cards described in the overview. You can interact with these sections to gain insights into sales performance and related trends.
Step 5: To customize the dashboard for your specific needs, you can change the data source, edit charts, or edit data using Power BI features like Power Query and Power Pivot.

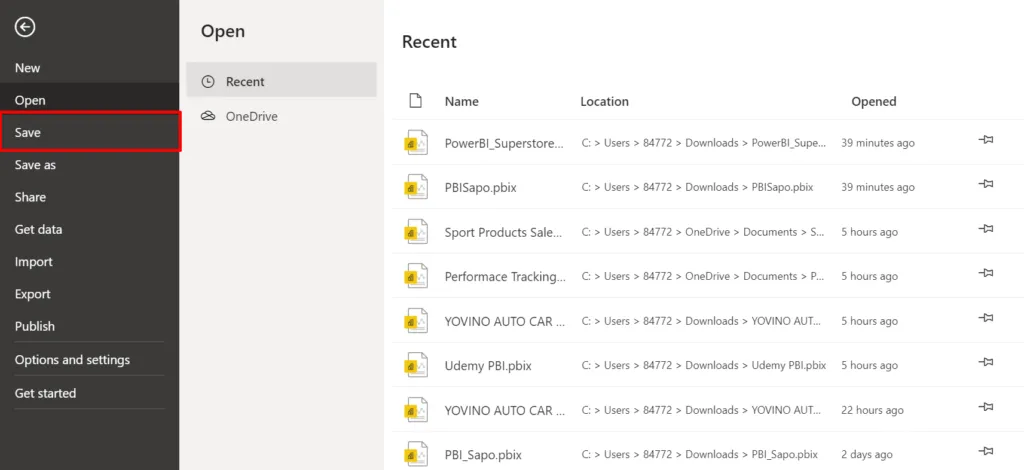
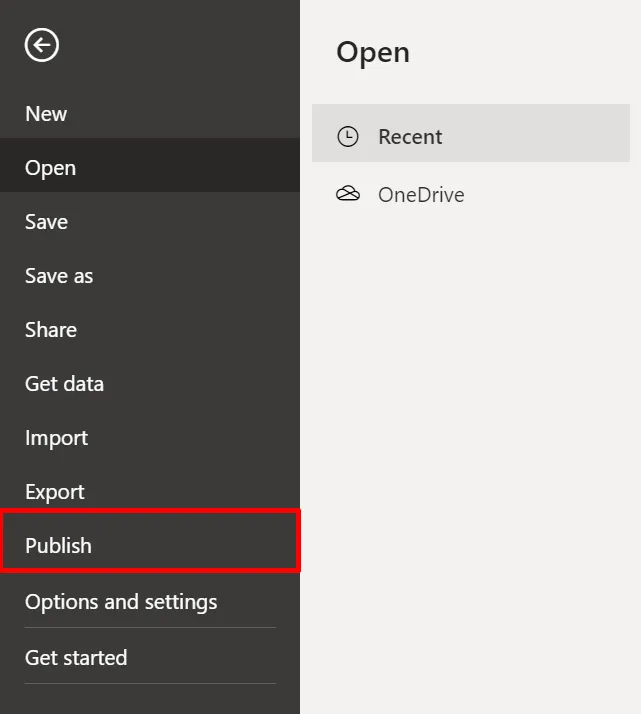
Step 6: Once you’ve finished editing and customizing the dashboard, you can save the .pbix file and publish it to Power BI Service to share with colleagues or your manager.
Keep in mind that to understand how to use specific features of Power BI to interact with and edit the dashboard, you may need to refer to Power BI’s documentation or take training courses on Udemy or other online education platforms.
Conclusion
Leveraging these Power BI templates for sales management can transform your sales strategy, providing the insights needed to make data-driven decisions. Each template caters to different sales and performance tracking aspects, ensuring that businesses can find the right tool to meet their unique needs. Hopes your sales teams can use these 7 free Power BI Templates to optimize strategies, improve performance, and ultimately drive greater revenue growth.
